
Designing Big Data Tables: UI/UX Principles and Best Practices
Anyone who has worked with a data-heavy table knows how quickly things can go sideways. A table that displays cleanly at 200 rows starts showing its cracks at 2,000 and takes decades to load.
Users call the table slow, confusing, or impossible to search, and they are usually right, because the design was never built for the volume it is now carrying. Designing big data tables is a separate discipline from designing standard tables.
Big data tables appear across nearly every context where structured information matters: CRM systems managing thousands of contacts, inventory platforms tracking hundreds of thousands of SKUs, and financial dashboards pulling years of transaction records. In every case, the challenge comes to a single question:
How do you present this much information in a way that people can actually find what they need, compare what matters, and take action without losing their place?
This article covers the design decisions that answer that, from column structure and filtering to data type treatment and rendering architecture.
Key Takeaways
- Big data tables are not just larger versions of small tables; they need a different design approach entirely
- Column structure, sticky headers, and real filtering are the three decisions that affect users most
- Data type determines display treatment: numbers, text, dates, and status fields each need different formatting
- Conditional formatting turns raw numbers into readable signals without adding extra columns
- Performance is a design problem: a table that loads in 12 seconds has already failed the user before a single design decision matters
- Ninja Tables handles all of these needs in WordPress, and the DataTables rendering engine adds server-side processing for datasets in the hundreds of thousands of rows
What Makes Big Data Tables Different
A regular data table displays a manageable set of records that users can read through. A big data table carries enough rows, columns, or density that users cannot find what they need by reading alone. They need the table to help them.
That shift from reading to working is what makes big data table design a separate problem. At the point where users cannot hold the full dataset in their heads, every design decision either helps them find, compare, and act on information or adds to the confusion.
The specific challenges that come with large datasets are consistent across contexts:
The volume of data can overwhelm users quickly. Hundreds of columns or thousands of rows without structure lead to scanning errors, missed information, and abandoned tasks. Users need the table to reduce visible complexity without hiding what they actually need.
Performance becomes a design constraint, not just a technical one. If a table takes more than a few seconds to load or respond to a filter, users disengage. The interaction design and the rendering architecture have to match.
Complex interactions like sorting, filtering, searching, and editing become harder to design as the dataset grows. Each one requires deliberate decisions about where controls live, how they behave, and what happens to the user’s position in the table when they apply them.
Start With Purpose Before You Design
Before any design decision, the most important question is what the table is actually for. Different users and different tasks require fundamentally different table designs, and getting this wrong at the start means no amount of good visual design fixes the result.
Ask three things:
- Who uses this table? Analysts, administrators, and sales teams each scan differently and need different columns and interactions surfaced first.
- What kind of data does it show? Financial figures, contact records, inventory, and log entries all have different display requirements that shape alignment, formatting, and column weight.
- What do users need to do with it? A read-only table needs a clean display. A table where users filter, edit, export, or act in bulk needs those capabilities built in from the start.
In a CRM context, for example, a sales team needs to filter contacts by status, sort by the last activity date, and send bulk emails directly from the table. A spreadsheet will replace a table designed without those workflows in mind within weeks.
What “Designing Big Data Tables” Actually Means
Designing big data tables refers to the discipline of structuring, organizing, and adding interaction to data grids that contain enough rows, columns, or density to exceed what users can comfortably process by reading alone.
The term “big” in this context is not a technical threshold. It is a UX threshold: the point at which a user can no longer complete their task through passive reading and needs the table interface to actively support them. That point varies by user, data type, and task.
A financial analyst scanning a 500-row ledger with 18 columns hits it faster than an operations manager reviewing a 5,000-row inventory list with four clean columns.
What makes big data table design distinct is that every standard UX decision carries a hidden cost at scale. Whitespace that reads as breathing room at low row counts becomes wasted screen space when a user needs to compare 50 records.
Progressive disclosure that protects users from information overload in standard forms hides the filter controls that power users need immediately. Type consistency that makes a UI look coherent makes it impossible to scan when every column carries the same visual weight.
Big data table UX is the practice of making these trade-offs deliberately, not by accident.
Large Data Table Design Principles
Big data table UX is not a niche concern. Enterprise WordPress development platforms, data applications, and major industry sectors leveraging big data all deal with user experience that breaks down at scale.
Designing big data tables for any of these means making several decisions that compound on each other. A choice made in column structure shapes how useful filtering becomes.
Getting one right while ignoring the others produces a table that still fails users, just in a different place. The place to start is the structure users see before they interact with anything.
Column Structure and Visual Hierarchy in Big Data Tables
The first column is the anchor. It tells users whether they are looking at the right row. In a CRM, it is the customer name. In an inventory system, it is the SKU. When the anchor column is buried or visually indistinguishable from metadata columns, users re-read every row before they can act.
After the anchor, column order should follow decision relevance. Fields users compare most often come next, then supporting context, then low-frequency metadata at the far right or behind a column visibility control. At 2,000 rows, a column order that matches how users actually scan makes a measurable difference.
Freezing columns for horizontal scroll
For wide tables that require horizontal scrolling, the anchor column must be frozen. When the identifying column scrolls away, users lose their position, scroll back to reconfirm the row, then scroll right again on every row they evaluate. Freezing the anchor eliminates this entirely.
In Ninja Tables, columns can be reordered by drag and drop, toggled on or off individually, and pinned to stay fixed during horizontal scroll in default mode tables. No custom code is required to configure any of this.
| No | Appointment | Patient’s Name | Gender | History | Treatment Type | Phone No | E-mail Address | Date of birth | Attendee |
|---|---|---|---|---|---|---|---|---|---|
| 1 | 5/10/2025 10:0 AM | Rick Nielson | Male | New Visit | Routine Check | +1 212 555 4567 | [email protected] | 3/16/1989 | No |
| 2 | 5/11/2025 11:0 AM | Pamela Tov | Female | Revisit | Crowns | +1 212 555 8756 | [email protected] | 7/22/1980 | Yes |
| 3 | 5/17/2025 11:0 AM | Jim Anderson | Male | New Visit | Bone Grafting | +1 212 666 2768 | [email protected] | 8/24/1996 | Yes |
| 4 | 5/21/2025 2:0 PM | Stanley Cooper | Male | New Visit | Scalling & Polishing | +1 212 555 3111 | [email protected] | 12/2/2000 | No |
| 5 | 5/14/2025 3:0 PM | Allison Sydney | Female | New Visit | TMJ Treatment | +1 212 777 3218 | [email protected] | 11/28/1997 | No |
| 7 | 5/14/2025 12:0 AM | Harvey Spencer | Male | Revisit | Dental Emergencies | +1 212 555 9034 | [email protected] | 2/17/2003 | Yes |
Sticky Headers and Display Density
When users scroll past the first screen of a big data table, the column headers disappear. They are reading values with no labels. In a table with similar-looking numerical data, this is where errors happen. Sticky headers keep the header row visible at every scroll depth, giving users permanent column context.
Ninja Tables applies sticky headers by default. The header row stays fixed as users scroll through any number of rows, with clear visual separation from data rows so there is no confusion between labels and values.
Matching density to the task
Row height determines how many records fit on screen at once. At comfortable spacing, a typical viewport shows 12 to 15 rows. A user reviewing 300 records scrolls through 9 screens at compact density versus 20 at comfortable spacing.
Careful record-by-record review needs room to read each row without rushing. Scanning a large dataset for anomalies needs maximum rows visible without extra scrolling. Ninja Tables supports row height adjustment so each table can be configured to match its actual use case.
| Factor | Infinite Scroll | Pagination |
|---|---|---|
| User Orientation | Content loads continuously ,Progress is fluid, but harder to mark exact points | Clear position (Page 2 of 10),Easy to resume in product/data tables |
| Info Processing | Provides uninterrupted flow ,Useful for browsing large collections or galleries,Endless feed, risk of overwhelm. | Breaks content into smaller sets.,Helpful for scanning product specs or structured data,Lower cognitive load |
| Navigation | Navigation is seamless,Returning to a previous scroll depth may need added features (URL updates/history). | Pages have unique URLs (?page=3) that can be bookmarked or shared.,Great for WP Posts, documentation, catalogs, and knowledge bases.,Interrupts the “flow.” More clicks, slower browsing. |
| SEO | Risky if JavaScript-only,Content can remain hidden without fallback pagination | Clean, crawlable URLs for each page,Search engines index product tables and categories well. |
| Accessibility | Can trap screen readers, footer hard to reach. | Screen-reader friendly, predictable focus. |
| Mobile UX | Taps add friction, but structure is stable | Natural scrolling, smooth but less reliable. |
| Performance | Loads fewer rows per page. Lighter and faster for big WooCommerce stores. | Content piles up in one page, causing slowdowns on mobile or large catalogs. |
| Analytics | Works well with e-commerce conversion funnels.Easy to track per-page metrics (CTR, conversions) | Harder to see where drop-offs point.Requires custom scroll-depth tracking. Harder |
| Best Fit | E-commerce stores, WooCommerce product table, WordPress data tables, research archives, forums. | Social feeds, news streams, discovery/inspiration sites, curation or showcase websites (e.g Pinterest, Facebook, X) |
Filtering and Search in Large Datasets
Search and filtering look similar in a table interface, but solve different problems. A search bar finds a known value: a user looking for invoice 4821 types it and lands on the row. Filtering works when the user knows the conditions but not the specific records, such as all overdue invoices above $10,000 in the European region.
Big data tables need both tools working together. Search handles direct lookup. Filtering handles exploration, where users narrow a dataset by structured conditions across multiple columns at once. Column-level filters should match data type: text columns get “contains” and “equals,” numerical columns get range operators, and date columns get before, after, and between options.
For users who run the same filter configuration regularly, saved presets remove the need to rebuild multi-condition filters from scratch every session. A sales manager checking overdue accounts each morning should be able to retrieve that filter in one click.
Ninja Tables includes real-time global search alongside column-level filtering. Filters apply per column with appropriate operators for each data type, and results update as users type or apply conditions. A category filter and a keyword search can run simultaneously on the same dataset.
Conditional formatting
Conditional formatting applies visual styling to cells based on their values: a negative balance turns red, a completion rate above 90% turns green, and an overdue date turns amber. In a big data table, this lets users scan for what needs attention without reading every cell.
The key is restraint. Applying conditional formatting to the two or three columns that carry the most decision-relevant values produces a scannable table. Applying it everywhere creates visual noise. Ninja Tables supports rule-based conditional formatting where cells or entire rows change styling based on value thresholds, status matches, or date conditions.
| First name | Last Name | Position | Office Branch | Age | Salary |
|---|---|---|---|---|---|
| Ashton | Brady | Accountant | London | 36 | 162,700 |
| Miles | Tenner | Integration Specialist | San Francisco | 41 | 372,000 |
| Harvey | Spencer | Regional Director | London | 42 | 470,600 |
| Mike | Sallanger | Personnel Lead | New York | 38 | 220,500 |
| Jaden | Hyatt | Team Lead | London | 35 | 240,700 |
| Donna | Hannigan | Senior Marketing Designer | San Francisco | 36 | 275,100 |
| Nile | Harris | Development Lead | New York | 37 | 345,200 |
| Allison | Kram | Integration Specialist | Sydney | 34 | 270,000 |
| Victor | Vincent | Accountant | Sydney | 40 | 170,500 |
| Bob | Randell | Accountant | New York | 41 | 190,750 |
| Hannah | Griffin | Senior Marketing Designer | London | 39 | 280,200 |
| Jennifer | Cowell | Regional Director | Sydney | 36 | 190,000 |
| Quinn | Basser | Regional Director | San Francisco | 37 | 360,500 |
| Hailey | Rogan | Integration Specialist | New York | 49 | 290,700 |
| Raphael | Kwan | Personnel Lead | San Francisco | 46 | 200,100 |
| Steven | Haider | Team Lead | New York | 35 | 270,000 |
| Bill | Conan | Regional Director | New York | 53 | 470,000 |
| Julia | Kingsley | Development Lead | San Francisco | 45 | 350,000 |
| Chris | Newman | Senior Marketing Designer | Sydney | 38 | 250,000 |
| John | Claude | Accountant | San Francisco | 50 | 135,000 |
Responsive Design for Big Data Tables
A big data table on mobile requires a deliberate strategy. A 12-column table compressed onto a 390-pixel screen is unusable. The right question before choosing an approach is what users actually need to do on a small screen, because that answer determines everything else.
Three strategies cover most use cases:
- Collapsed card view: Each row becomes a summary card showing the anchor field and key values, with a tap to expand the full record. Best for individual record lookup, not cross-row comparison.
- Horizontal scroll with a frozen anchor column: The table keeps its full structure, the anchor stays fixed, and users scroll right through the remaining columns. This suits comparison tasks where seeing multiple columns matters.
- Priority column display: Only the two or three most important columns appear at small viewport widths, with a control to reveal the rest. Best when mobile access is primarily for status checks.
Ninja Tables supports multiple responsive modes, allowing each table to use the layout approach that best fits its content and users. For priority-based display, the responsive breakpoint feature lets you control which columns stay visible and which move into the “initial hidden” state, creating a cleaner user experience even across thousands of rows in big data tables.


![Product Launch Strategy: Step-by-Step Guide + Templates [2026]](https://wpmanageninja.com/wp-content/uploads/2026/04/Product-Launch-Strategy_-Step-by-Step-Guide-Templates-2026-600x336.webp)

![How to Add Chapters to YouTube Videos [+ WordPress Embed Guide]](https://wpmanageninja.com/wp-content/uploads/2026/04/How-to-Add-Chapters-to-YouTube-Videos-WordPress-Embed-Guide-600x314.webp)
![How to Make Money Selling Quizzes in WordPress [Beginner’s Guide]](https://wpmanageninja.com/wp-content/uploads/2026/04/How-to-Make-Money-Selling-Quizzes-in-WordPress-Beginners-Guide-1-600x336.webp)


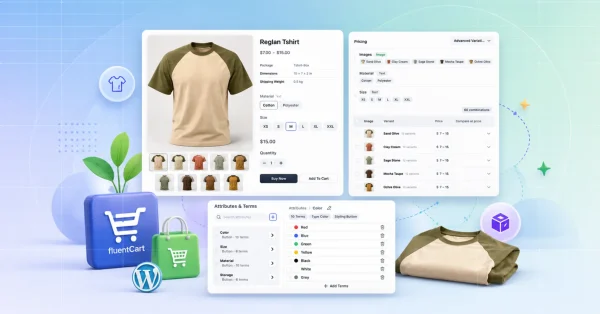
![FluentCart First Look: The Revolutionary eCommerce Plugin for WordPress [6 Key Advantages]](https://wpmanageninja.com/wp-content/uploads/2025/06/FluentCart-First-Look-600x314.png)


![How to Increase Online Sales for your eCommerce Site [Secret Tips]](https://wpmanageninja.com/wp-content/uploads/2023/08/How-to-increase-eCommerce-sales-600x314.png)


![5 Best Help Desk Software for Small Businesses [2026]](https://wpmanageninja.com/wp-content/uploads/2022/09/Helpdesk-software-for-small-businesses-02-min-600x314.png)


![Best Gutenberg Blocks in WordPress [Block Editor Plugins]](https://wpmanageninja.com/wp-content/uploads/2025/12/Gutenberg-Blocks-in-WordPress-600x314.webp)


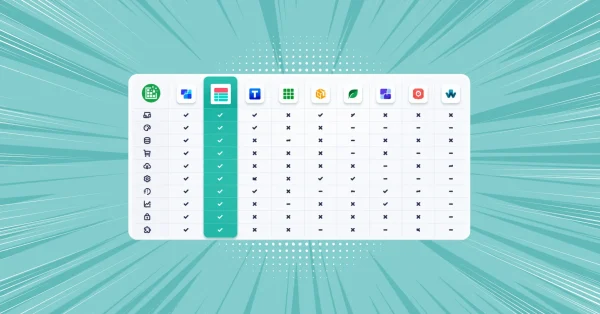
![wpDataTables Vs Ninja Tables - Which One Is The Best [A Comparative Study]](https://wpmanageninja.com/wp-content/uploads/2020/03/FT-600x314.png)


![11 Best GDPR Plugins to Make Your Website GDPR Compliant [1 Bonus]](https://wpmanageninja.com/wp-content/uploads/2018/10/10-Best-GDPR-Plugins-to-Make-Your-Website-GDPR-Compliant-600x279.jpg)


The UX Problem With Slow Big Data Tables
UX research on user behavior under system delays consistently identifies a threshold: when a system takes more than 10 seconds to respond, users lose their train of thought, and their attention drifts away from the task. This is not a soft guideline. It is a documented behavioral ceiling, observed across interfaces from web search to enterprise software.
This is why designing big data tables cannot be separated from how the data gets to the table. A designer who specifies column groupings and filter interactions without understanding whether the table uses client-side or server-side rendering is designing for a performance profile they have not verified. Client-side rendering, where every row loads into the browser before the table becomes interactive, breaks at a few thousand rows on average hardware. Server-side processing, where the browser receives only the current page of results and requests more on demand, keeps load time flat regardless of total row count.
The design implication is direct: the interaction patterns chosen for a big data table need to match the architecture underneath it. Designs that assume instant filtering and real-time search need a rendering architecture that can deliver both. When that alignment does not exist, the UX fails at the performance layer before it fails at the design layer.
Performance Is Part of the Design
Every design decision in this guide depends on the table loading fast enough for users to stay focused. Standard WordPress table plugins use client-side rendering, where every row loads into the browser on page load, and JavaScript handles all sorting, filtering, and pagination locally. For a few hundred rows, this works. At 5,000 rows, it slows noticeably. At 20,000 rows, it often fails.
Server-side processing in WordPress
The architecture that handles large datasets reliably is server-side processing. The full dataset stays in the database. The browser requests only the rows for the current view, and every sort, filter, or page turn returns only the matching results. Load time stays flat whether the table holds 5,000 rows or 500,000.
Ninja Tables introduced the DataTables rendering engine as an opt-in option per table. It brings native server-side AJAX pagination and processing into the plugin without custom code or manual DataTables setup. Large CSV files are imported through a chunk-based process that avoids PHP memory limits on shared hosting. For tables where volume is not a concern, the default rendering engine is unaffected.
Full configuration details are in the Ninja Tables 5.2.8 release notes. For a broader look at how big data table support works in WordPress, the big data tables in WordPress guide covers the performance and architecture layer in depth.
Wrapping Up
Designing big data tables well comes down to a set of deliberate decisions: column order that matches how users scan, sticky headers that keep context visible, filtering that matches how users actually explore data, density control that fits different workflows, and a mobile-first strategy built around the actual task.Each of these decisions is independent of aesthetics.
The table can look good and still fail users if the structure, the interactions, and the rendering architecture do not support how they need to work with it.
These patterns may still sound ambitious, but the implementation ceiling that once limited them in WordPress is no longer as fixed as it used to be.
For WordPress users, Ninja Tables covers the full stack, from column configuration and conditional formatting to server-side AJAX and processing at real scale. Start with theNinja Tables and see how it handles your actual data.

Hi there! I’m a creative content writer at Ninja Tables, WPManageNinja. I love writing on diverse topics and when I’m not writing, you’ll find me chilling with a book.
-

13 Best Wireframing Tools in 2026: Free, AI & Paid Options
Compare 13 of the best wireframing tools for websites and -

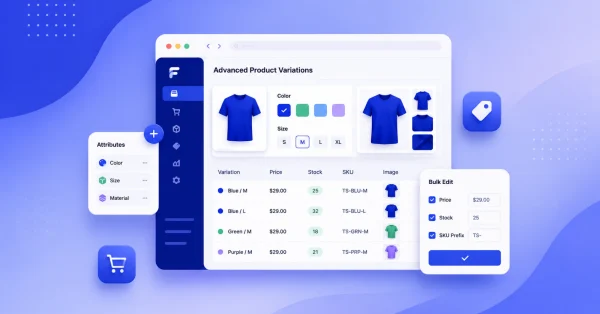
Advanced Product Variations, Built In and Free with FluentCart
Most WordPress eCommerce plugins charge extra for advanced product variations -

Server-Side Processing For WordPress Tables: Why Big Data Tables Need It
Most WordPress tables break under real data volume. Here’s what
Leave a Reply
You must be logged in to post a comment.