Do you want to create different online charts on your website? Well, no, worries! Ninja Charts is a powerful chart generator that allows you to create and use numerous types of charts in WordPress.
Just by following a few simple steps, you can generate amazing charts in different formats.
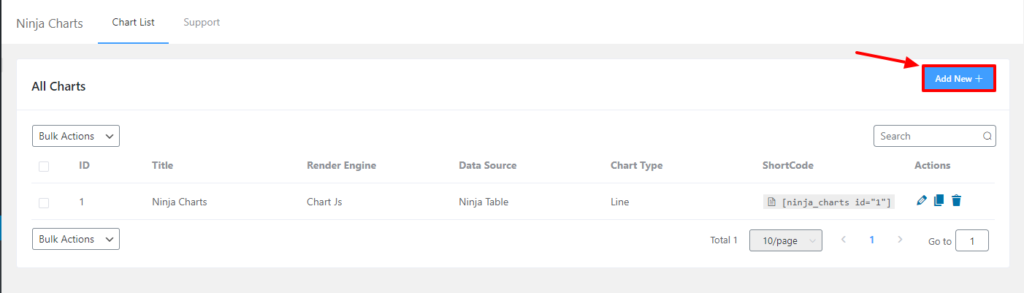
- Step 1: Click the Add New button after installing Ninja Charts.
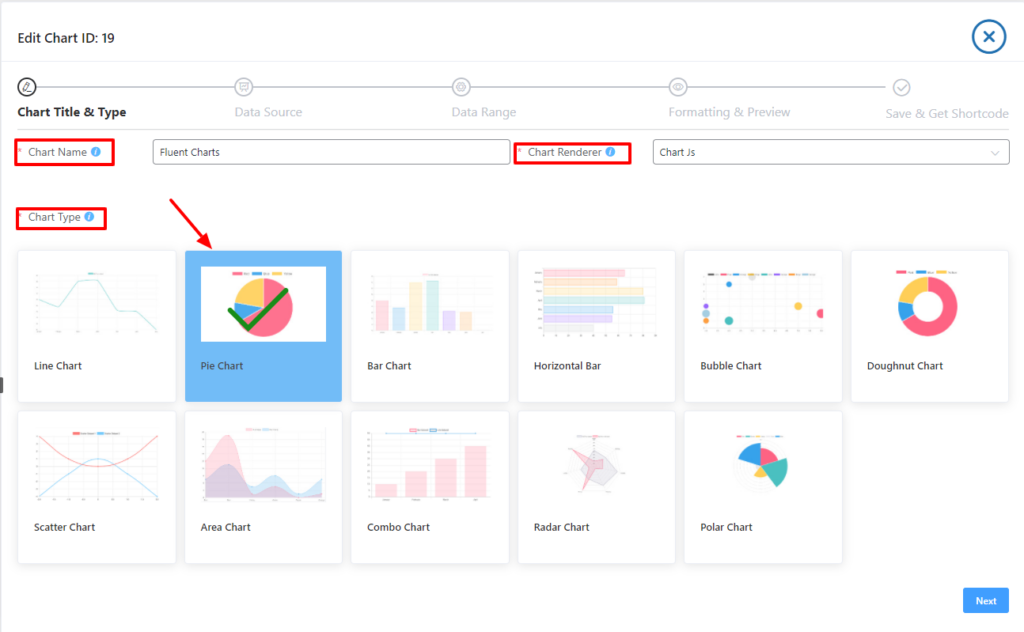
- Step-2: Put your chart name in the title ➟ choose a chart to render engine ➟ select your preferred chart type from the dashboard ➟ then click on the Next button.
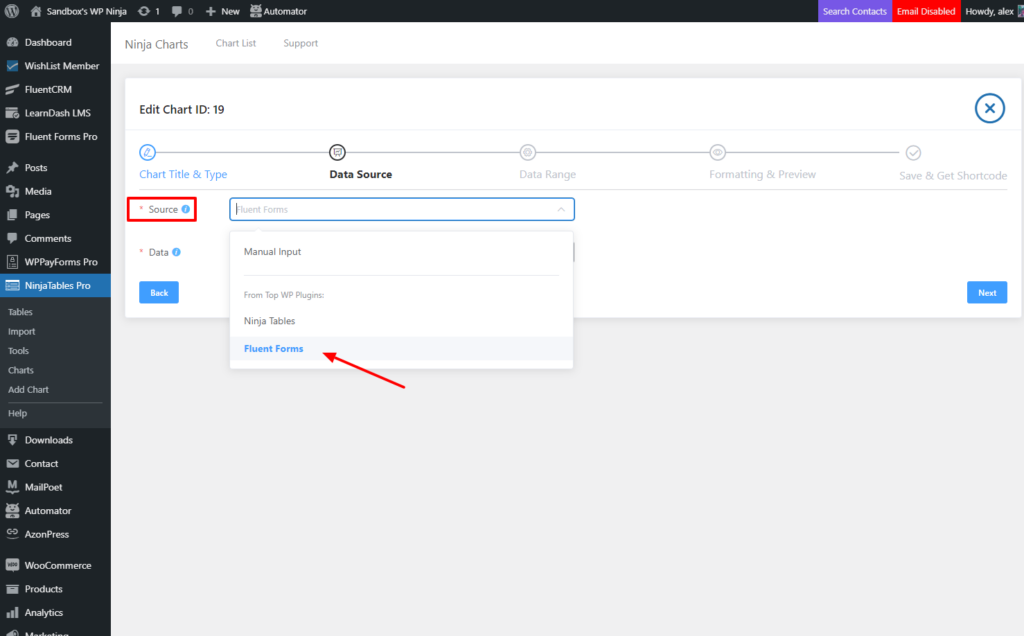
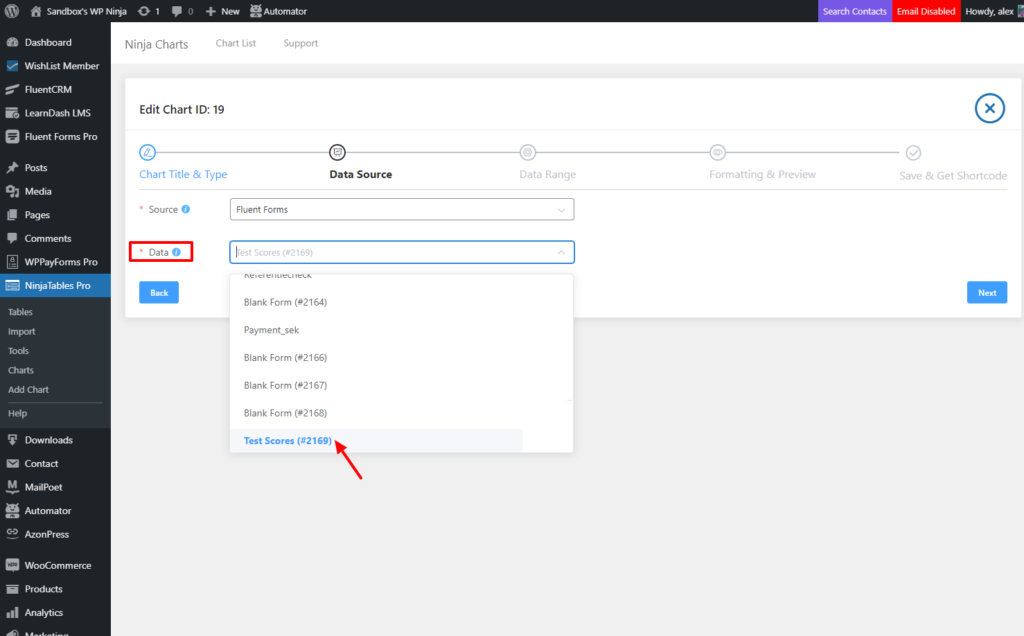
- Step-3: From the Data Source select Fluent Forms ➟ Click on the Next button
Step 4: Now, choose the preferred form that you want to create a chart with.
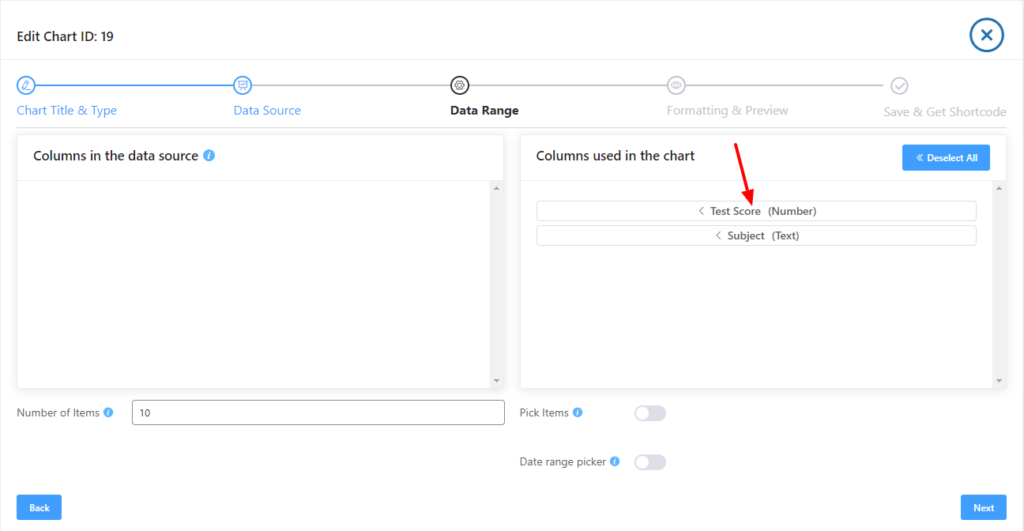
- Step-5: Then, you’ll get the option to drag & drop the desired columns and click on the Next button.
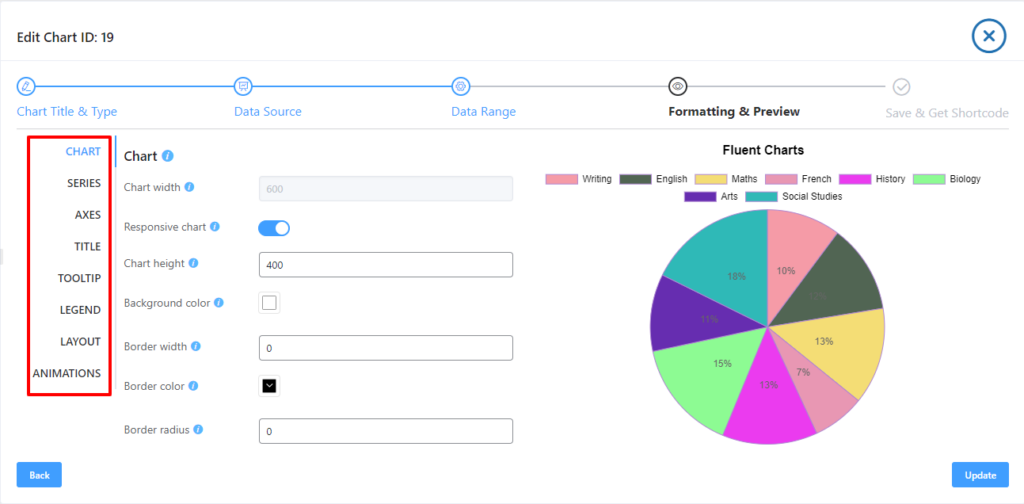
- Step-6: Next, here you will get the prepared chart with customization options in the Formating & preview. Once you’re done with the necessary customization, click on the Next button.
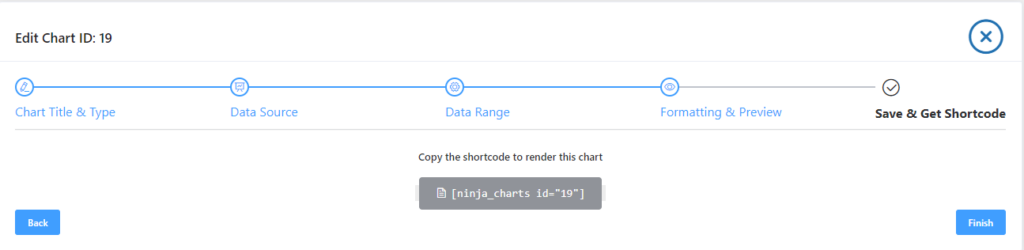
- Step-7: Once you click on the Next button, you are done with the process and you will see a shortcode-based chart has been created.