Customer Satisfaction Index: CSI Meaning and Metrics
Have you ever wondered how companies gauge whether their customers are truly satisfied? One of the key tools they rely on is the Customer Satisfaction Index (CSI).
This index provides a clear, numerical representation of customers’ satisfaction with a company’s products, services, or overall experience. Often displayed as a percentage or on a scale from 0 to 100, it offers businesses a straightforward measure of customer satisfaction and loyalty.
Understanding the Customer Satisfaction Index (CSI) helps businesses assess whether they’re meeting customer expectations. And by knowing their customers’ satisfaction levels, companies can pinpoint areas for improvement and make more informed decisions about where to focus their resources.
TL;DR
- A Customer Satisfaction Index is a weighted composite score built from multiple survey attributes, not a single-question rating
- Companies calculate it by defining key attributes, surveying customers, and computing a weighted average
- CSI, CSAT, NPS, and CES each measure a different dimension of the customer experience
- Scores above 80 out of 100 are generally considered excellent across most industries
- Low attribute scores inside a CSI point to exactly where the customer experience is breaking down
What is the Customer Satisfaction Index?
Customer satisfaction index captures customer feedback on various aspects such as product quality, service effectiveness, and overall interaction with the company.
First, companies define the target customer group (new, existing, or both) to be surveyed. Then they create a clear questionnaire asking customers to rate their satisfaction. This is usually done using a scale that ranges from very dissatisfied (0) to very satisfied (100).
The data is then collected through surveys conducted online, via email, over the phone, or through other channels.
Once data is gathered, it is analyzed to calculate a weighted average of the responses and produce the final customer satisfaction index score.
Companies also compare their scores against past results or industry benchmarks, which shows their strengths and where improvement is possible.
Importance of Customer Satisfaction Index (CSI) for Businesses
Customer Satisfaction Index (CSI) is a vital metric. High CSI scores drive loyalty, positive word-of-mouth, and higher revenue.
While low scores highlight areas for improvement and the prevention of customer churn. Here’s the breakdown.
Customer-centric decision making
Customer Satisfaction Index (CSI) shows which parts of the experience customers value most and which parts are falling short. That clarity leads to better decisions about where to invest time, budget, and effort.
If a team that knows customers are scoring product reliability at 8.4 but support quality at 5.4 does not need a brainstorming session to find its priority. The data has already made the decision. That is the practical difference between a well-built index and a general customer satisfaction survey.
It also drives product and service innovation. When customers consistently rate a specific attribute below others, it signals an unmet customer expectation. Teams that act on that signal can build products and support systems that customers actually want.
Impact on revenue and growth
Research published in the Journal of Marketing found that a stock portfolio selected entirely based on high customer satisfaction scores returned 518% between 2000 and 2014, compared to 31% for the S&P 500 over the same period.
This proves that satisfied customers come back. And, they also bring others with them. Both outcomes lower acquisition costs and extend customer lifetime value over time. Monitoring CSI consistently gives businesses an early warning signal that something is slipping before it shows up in churn data or revenue reports.
How is Customer Satisfaction Index (CSI) measured?
Typically, there is no single universal formula for calculating a Customer Satisfaction Index (CSI). It’s measured by surveying customers to rate various attributes of a product or service, usually on a scale of 1-10.
Let’s understand the metrics and formula.
Customer Satisfaction Index (CSI) metrics and methodology
Most businesses build their own by selecting the attributes most relevant to their context. The process follows the same general structure regardless of industry or business size.
The most common data collection methods are:
- Online surveys sent after a purchase or key customer interaction.
- Email questionnaires targeting existing customer segments.
- Phone interviews for higher-touch or enterprise relationships.
- In-app or in-product prompts embedded at key experience moments.
Customer Satisfaction Index (CSI) calculation formula
As you already understand the method of CSI. Follow these 5 steps to calculate a Customer Satisfaction Index score for your business:
- Define your target group: Decide whether you are surveying new customers, returning customers, or both, since their experiences and expectations differ considerably.
- Identify 3 to 5 attributes: Choose the factors that matter most, such as product quality, pricing fairness, ease of use, or support responsiveness.
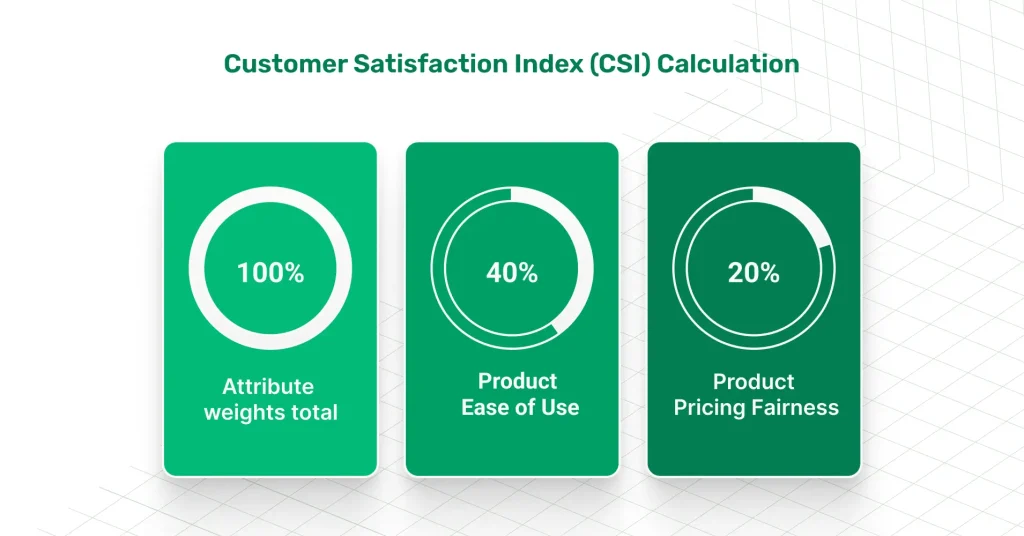
- Assign a weight to each attribute: Weights must total 100%. For a SaaS product, ease of use might carry 40% while pricing fairness carries 20%.
- Survey customers: Ask your customers to rate each attribute on a scale of 1 to 10.
- Calculate the weighted average: Multiply the average score for each attribute by its weight. Then sum the results. That is your Customer Satisfaction Index (CSI) score out of 100.
Here is a practical example using a WordPress plugin business that surveyed 300 customers:
| Attribute | Weight | Avg. Score (1–10) | Weighted Score |
|---|---|---|---|
| Plugin reliability | 45% | 8.4 | 3.78 |
| Support response quality | 35% | 7.1 | 2.49 |
| Pricing fairness | 20% | 6.8 | 1.36 |
| Total CSI | 100% | 76.3 / 100 |
Support response quality is the weakest link in this result. That single data point tells the team exactly where to act, without any guesswork involved in the process.
Use CSI results to improve customer experience
The most useful part of any Customer Satisfaction Index report is not the overall score. It is the per-attribute breakdown.
A company scoring 9.1 on product quality and 5.2 on support quality has one specific problem to solve, not a general customer experience challenge.
The most effective teams close the customer feedback loop by assigning each low attribute score to a specific owner with a structural fix and a deadline. That is what actually moves attribute scores over time.
Best practices for maximizing Customer Satisfaction Index (CSI)
Best practices for maximizing the Customer Satisfaction Index (CSI) include regular monitoring, clear communication with customers, and employee involvement.
These practices help to identify trends early, build trust through feedback-driven actions, and ensure employees understand their role in improving customer experiences.
Frequent monitoring and adjustments
Run Customer Satisfaction Index (CSI) surveys on a fixed quarterly cadence. That frequency produces enough data points to identify trends without over-surveying your customers.
Annual measurement is too infrequent to catch problems early. A pattern across three consecutive quarters is a fact that demands a structural response.
Customer communication
Customers who receive acknowledgment after providing feedback are more likely to respond to future surveys. When a low attribute score triggers a product or service change, communicating that change to customers closes the loop and proves valuable customer feedback that led to a real outcome.
This practice is often called “you said, we did” communication. It builds the kind of trust that sustains long-term satisfaction scores. It also separates businesses that genuinely act on customer data from those that collect it and file it away for quarterly presentations.
Employee involvement
Lastly, a support team that understands how its response times affect the support quality attribute in the company’s index has a concrete reason to care about the number.
Sharing attribute-level Customer Satisfaction Index data with support teams, turns the index into an operational tool. That is the difference between a metric that changes behavior and one that simply reports it.
Real-world examples
The American Customer Satisfaction Index publishes satisfaction scores for recognizable companies monthly. This is one of the most useful public benchmarks available on CSI.
- In consumer electronics, companies like Apple and Samsung consistently score in the high 70s to low 80s.
- Airlines and internet service providers have historically clustered in the low-to-mid 60s.
- E-commerce companies have outscored brick-and-mortar retailers for over a decade on ACSI data.
The gap is explained by faster fulfillment, easier returns, and lower checkout friction. Any product or service business can use that sectoral difference as a calibration point when setting targets for its own index attributes.
For a WordPress product business, a practical starting point is three attributes:
- Product reliability
- Support quality
- Pricing fairness
Survey 200 to 300 customers, calculate the weighted average, and compare the result quarter over quarter. The trend across four to six surveys is far more informative than any single score taken in isolation.
Wrapping up
A customer satisfaction index is not just a number. It is a diagnostic tool that tells businesses which part of the customer experience is earning loyalty and which part is driving people away.
Start with three attributes, run surveys quarterly and focus on the attribute breakdown rather than the headline score. If support responsiveness keeps dragging your index down, Fluent Support gives your team the tools to fix that.
Frequently Asked Questions
What is a good CSI score?
Generally, a score above 80 out of 100 is considered excellent, based on ACSI benchmarking data across industries. Scores in the 70s represent average satisfaction.
Scores below 60 signal that core attributes are consistently underperforming. Always compare your score against your own historical trend and your industry benchmark rather than a single generic threshold. (ACSI)
How often should CSI be measured?
Quarterly is the right cadence for most businesses. It produces enough data to identify trends without triggering feedback fatigue in your customer base.
Annual measurement is too infrequent to catch problems early enough to act. Monthly measurement is usually more intensive than the data justifies for most business sizes and transaction volumes.
How is CSI different from CSAT?
CSAT measures satisfaction with one specific interaction, such as a single support ticket or a purchase. CSI measures satisfaction across multiple weighted attributes of the entire customer relationship.
CSAT is transactional and short-term. CSI is comprehensive and ongoing. Both are useful, but they answer different questions and should not substitute for each other.
What tools can businesses use to measure CSI?
Survey platforms such as Typeform, SurveyMonkey, or Google Forms handle data collection. Weighted average calculation can be done in a spreadsheet.
For automation, customer experience platforms such as Qualtrics or Medallia handle weighting, trend tracking, and industry benchmarking. For support-specific attribute data, a dedicated helpdesk tool already holds much of what is needed.
Can a small business build a CSI?
Yes. Three attributes, a simple survey, and a spreadsheet are enough to produce a meaningful, trackable score.
The discipline of running the survey on a fixed schedule and acting on the attribute breakdown matters far more than the sophistication of the tools involved. The index scales with the business over time.

I’m a digital marketer passionate about turning data-driven insights into meaningful customer growth. I specialize in organic strategy, market research and content writing that connects brands with real human.
-

How To Provide Better Customer Service For B2B Customers
According to a survey, around 61% of customers change brands… -

5 Best Help Desk Software for Small Businesses [2026]
Stop overpaying for help desk software. Compare 5 help desk -

Leave a Reply
You must be logged in to post a comment.