Are Search Console Impressions and Clicks Related?
Share :

We will never spam you. We will only send you product updates and tips.
Before the rollout of the August 2024 update, I was sifting through my website’s data on GA4. Now, for those who are well-versed, it’s common knowledge that SERP positions drop over weekends that are immediately recovered on the following weekdays.
There are some prevalent theories trying to explain this SERP behavior. However, none of these can be deemed the definitive explanation. With a peaking curiosity I got to doing what I do best, look at data and see if there’s something worth finding.
But before diving into the rabbit hole that I’ve spent a couple weeks on, let me explain why I did what I did.
The Weekend dip
All GA4 performance graphs look something like this in most niches (Shout out if it’s not the case for you). As if mimicking an organic pulse over the period of a complete week.
Initially, it looks as if the CTR and Impressions are dropping based on the drop in organic search intent. You’ll be left with the impression that less people are searching your KW’s on weekends.

You’re not the only one though. I assumed that to be the case as well.
I began to question this after noticing that the dip isn’t staying consistent but rising with the upper traffic limit of the weekdays.
For instance, when my site got 500 traffic on Mondays, the corresponding traffic on Saturday dropped to below 200. Consider it a round 60% drop on the weekends.
However, when the traffic on Mondays increased to 800 the weekend traffic also increased to around 320. Reflecting the 60% drop but leading to more clicks and impressions overall.
If the weekend dip is only due to user behavior, how is this 60% drop holding consistently? I mean isn’t user behavior supposed to be more dynamic and erratic?
It was time to actually start digging into this.
According to SEJ the explanation for this SERP behavior is a bug in the Search Algorithm. Assuming that’s the case, this behavior has been reported by many. Google’s inaction towards this so-called “bug” seems a bit weird.
GA4 data points to something even weirder
Now, making a case based on a single site is nowhere near comprehensive. So, I went about asking colleagues for their GA4 data.
First off, they’re all working in the same niche and unsurprisingly experienced the same weekend dip. Although the drop percentages varied between weekday and weekend. But the graph was there, showing the same pattern.
As it shows, of the 6 sites I analyzed, all had their average positions drop for their top content during weekends. Now, the burning question becomes which factor is the cause of lower traffic? A drop in organic search volume? Or an increase in average position?
Considering this, I started drawing correlation statistics for the weekend and weekdays Impressions and Average positions, to see if there truly was a lower search volume, or if the content was getting deranked on weekends and elevated back on the weekdays.
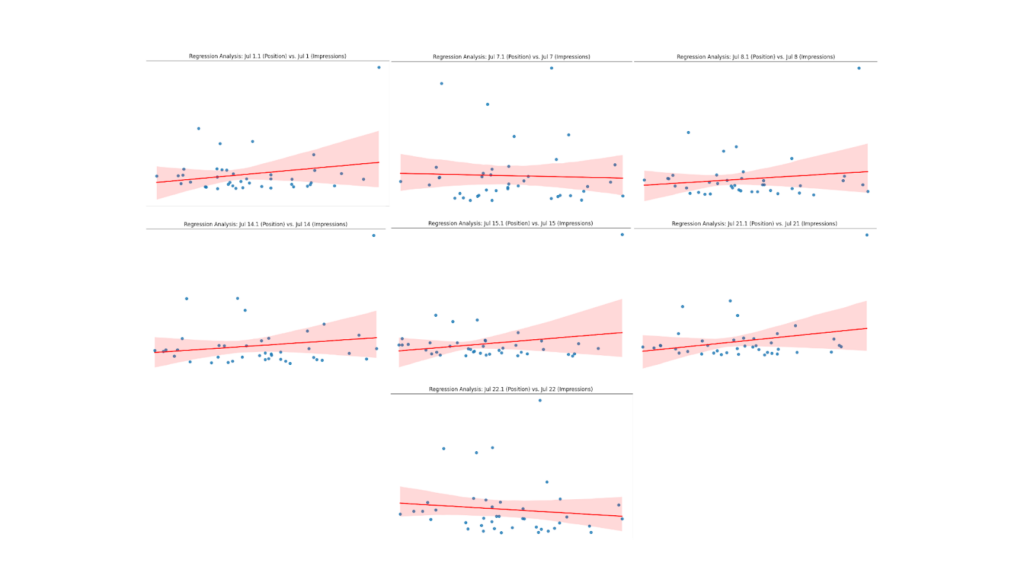
I took traffic and average position data for Mondays and following Saturdays for the 6 websites. Here’s what the correlation slope looks like for 4 of the sites.
These 4 sites showed a negative correlation between impressions and average positions based on the same data on the same dates. Which is to be expected because numerically, as positions improve the values go down.
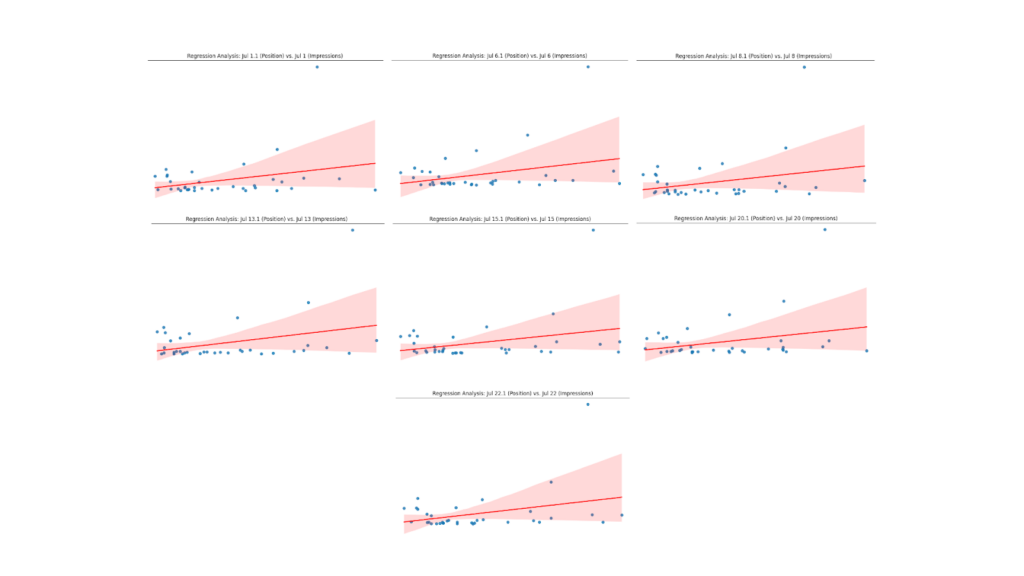
The weirdness starts when we analyze the larger sites among the 6. Here’s the larger 2,


See the upward slope? This means positions and impressions are positively correlated. Meaning, impressions increase as the position increases (ranks lower on SERP). There is absolutely no good explanation I can provide for this. Not to mention it defies common sense.
So to make sure, I ran the correlation study on one of the smaller and one of the larger sites with data over this year (Jan ‘24 – July ‘24). The slopes hold true as you can see before. The smaller site follows the logical convention of negative correlation.

On the other hand the larger site shows positive correlation, which again doesn’t make sense with the larger data size.

Take away from data
So this is what I’ve found. Even in the same niche, and with apparently similar traffic behavior, trends can go in opposite directions.
I was hoping to get some answers, instead I’m left holding this abomination of data analytics and even more ridiculous questions. Can someone explain how a site can get more impressions as their ranks deteriorate?
More importantly, how is an organic metric like user behavior making people behave so consistently, that the weekend dips hold no matter the change in traffic.
Declarations
For generating these graphs, I’ve used the exported CSV files from GA4. After performing some data cleanup from the bulk exports, I ran a Python script to first organize the data into custom dataframes. From this data the correlation and regression graphs were plotted.
Python modules used:
import pandas as pd

from sklearn.linear_model import LinearRegression

import matplotlib.pyplot as plt

import seaborn as sns

from scipy.stats import pearsonr
Aside from the modules and data sources stated, no other data manipulation was done to the original data set.
Data points:
I’ve used the Impressions vs. Avg. Position comparison to find the correlation between them. The data points are, Mondays and Saturdays in the month of July. Along with that for the large sites plots, I used impression and average position data of 2024 from January to July.
NDA:
The graphs as you’ve noticed do not contain any reference markers on the axis. This is to keep the data provided by my colleagues private. If in the case anyone wants to inspect the data first-hand, it will be subject to agreeing to sign an NDA.
Otherwise, this is the best I can provide for the purpose of making this case.
Wrapping up
This little experiment doesn’t actually make any significant claims. However, it does show there are inconsistencies on how Google is maintaining its Search algorithm. A lack of explanation for the weekend behavior, and ignoring the problem altogether leave me skeptical about what the priorities are at Search.


Leave a Reply
You must be logged in to post a comment.